Verifying Service Mesh TLS in Kubernetes, Using ksniff and Wireshark

Alongside Nic Jackson from HashiCorp, I have recently presented at several conferences and webinars about the need for transport-level encryption that spans end-to-end, or “user to service”, within modern applications. TLS encryption (and termination) for traffic from a user’s browser to the application edge has been a long-standing feature of API gateways, CDNs and edge proxies, but only recently has service mesh technology made implementing TLS for service-to-service traffic a realistic approach for most of us.
Many service mesh implementations promise low-touch TLS implementation, allowing operators to enable this with a single config option or a few lines in a YAML file. However, how do you actually know your inter-cluster traffic is actually being encrypted successfully? Sure, you can fire up tcpdump within a Pod running in a Kubernetes cluster, but this can be tricky to manage, especially for those not super comfortable with Linux tooling. After a spate of recent service mesh investigation and TLS debugging, I bumped into the ksniff kubectl plugin from Eldad Rudich. This has proved to be a useful tool for examining traffic within a cluster.
I wanted to share my learnings from using ksniff, and provide a couple of examples based on my recent investigation of TLS communication between an API gateway and the first internal hop to a service mesh.
ksniff — all the goodness of Wireshark, running in Kubernetes
According to the project’s GitHub repo, ksniff is a “plugin to ease sniffing on Kubernetes pods using tcpdump and wireshark”. I’ve used tcpdump and Wireshark to inspect network traffic for many years, but I have found it somewhat tricky to use within Kubernetes. Using a simple kubectl plugin like ksniff removes nearly all of the manual pain of configuring the two traffic sniffing tools.
You can install ksniff using the kubectl plugin package manager, krew:
$ kubectl krew install sniffI’ve also previously installed ksniff manually (as I wanted to access a feature that wasn’t at the time available in the krew package), and this was easy to do, and well documented, too.
You will also need to install Wireshark on your local machine. I’ve typically done this via the website download, but you can also find Wireshark via most package managers like apt and brew.
Now that you’ve installed the tools, let’s run through a demo.
Sniffing Unencrypted edge-to-service traffic
I’ve deployed the Ambassador API gateway and HashiCorp’s Consul service mesh via Helm into a GKE-hosted Kubernetes cluster. Due to the integration between Ambassador and Consul, I can make a request to an API endpoint exposed via Ambassador (that is managing a GCP load balancer) and have this request dynamically routed via a TLS connection from the gateway to any internal service that Consul manages.
I can also use Consul as a simple service discovery mechanism for Ambassador, which enables the dynamic routing of traffic, but without using transport encryption. Let’s do this first, as this way; you can see the unencrypted traffic via ksniff.
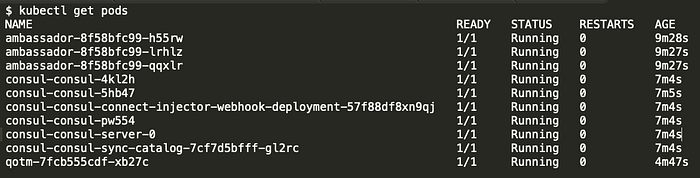
I’ve installed Ambassador, Consul, and a “quote of the moment (QOTM)” service as documented in the first half of the gateway/mesh integration docs. Looking in my cluster, I see the following Services running:
I can make an external request to my QOTM application that is exposed via the /qotm-consul/ endpoint, which is routed via Ambassador and Consul
$ curl -v 34.67.222.12/qotm-consul/
*   Trying 34.67.222.12...
* TCP_NODELAY set
* Connected to 34.67.222.12 (34.67.222.12) port 80 (#0)
> GET /qotm-consul/ HTTP/1.1
> Host: 34.67.222.12
> User-Agent: curl/7.54.0
> Accept: */*
>
< HTTP/1.1 200 OK
< content-type: application/json
< content-length: 174
< server: envoy
< date: Mon, 05 Aug 2019 08:30:18 GMT
< x-envoy-upstream-service-time: 1
<
{"hostname":"qotm-7fcb555cdf-xb27c","ok":true,"quote":"Nihilism gambles with lives, happiness, and even destiny itself!","time":"2019-08-05T08:30:18.802450","version":"1.7"}
* Connection #0 to host 34.67.222.12 left intact
Everything looks good with this request, and I’m starting to feel wiser already after reading this quote of the moment… :)
Let’s make another request, but view the internal inter-cluster network traffic via ksniff. First, I need to get the name of the QOTM service’s Pod, as this is where I’ll be attaching ksniff
Now I can attach ksniff to this Pod with a simple command via my local machine:
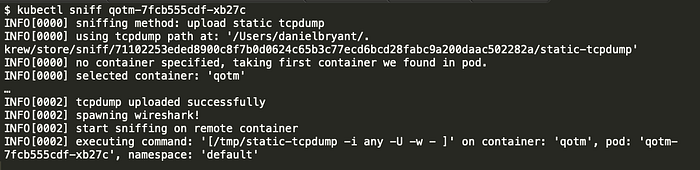
You can see in the CLI output all of the tcpdump configuration, and if all goes well, Wireshark should launch, which will display this window:
The Wireshark UI can appear daunting at first, but it’s not too complicated. The menu bar at the top allows you to start and stop network traffic capture and search and navigate the traffic data captured. There is also a display filter just below the menu bar. The top window shows traffic packets flowing to and from your Pod’s network interface, the middle window provides an overview of the traffic (such as protocol details and header metadata), and the bottom window shows the traffic packet contents.
You can apply a display filter to only show HTTP traffic by simply typing “http” into the filter box (below the menu bar) and hitting return. Now, if you request the gateway, you should see the Pod handle this and generate a response:
$ curl 34.67.222.12/qotm-consul/
{“hostname”:”qotm-7fcb555cdf-xb27c”,”ok”:true,”quote”:”Nihilism gambles with lives, happiness, and even destiny itself!”,”time”:”2019–08–05T08:40:28.469624",”version”:”1.7"}
You can ignore the copious amounts of GET /health HTTP requests, as these are generated via the Kubernetes Node’s kubelet, where this Pod is deployed, as a result of the Deployment’s readiness check.
What is interesting is the GET / HTTP request, which is highlighted by the red box. You can see the inbound HTTP request comes from 10.60.2.2, and this results in a response with a 200 HTTP status code that was generated by a Python server (show via the first red arrow) that is the QOTM service, and the HTTP payload (shown via the second red arrow) is the same as the results viewed when you issued the curl request to the cluster.
If I look at all of the Pods’ configurations, I can see that the traffic source IP of 10.60.2.2 within the cluster belongs to an Ambassador Pod, and the destination of 10.60.1.6 belongs to the QOTM Pod. This seems reasonable, as I’m making an external request that Ambassador is routing via a Consul service lookup through to the Pod IP.
At this point, I would encourage you to make a few more requests to the cluster, perhaps deploy your own services, and continue to explore the requests flowing around the cluster.
Let’s now enable the Ambassador and Consul service mesh mTLS integration, which will encrypt all traffic from the edge and service-to-service, and look at the traffic generated with this configuration.
Peaking at Encrypted edge-to-service traffic
To keep things simple I would recommend terminating your current ksniff connection to the QOTM Pod, and deleting the current QOTM service and mapping from your Kubernetes cluster.
After this, you can go back to the “Encrypted” section within the Ambassador and Consul integration docs and install the second version of the QOTM service that uses Consul Connect and an Envoy side car to manage all traffic handling to and from the pod. Don’t forget to apply the ambassador-consul-connector.yaml without this, the demo won’t work.
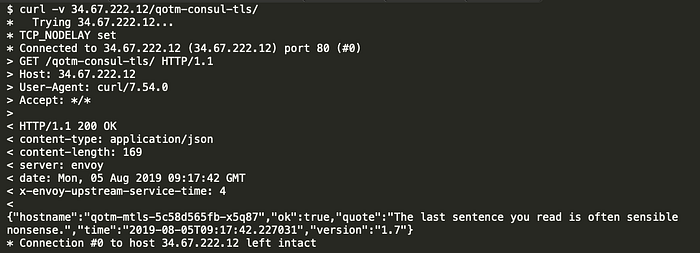
Once everything is up and running, you should be able to make a request to this modified version of the service via the new endpoint /qotm-consul-tls/
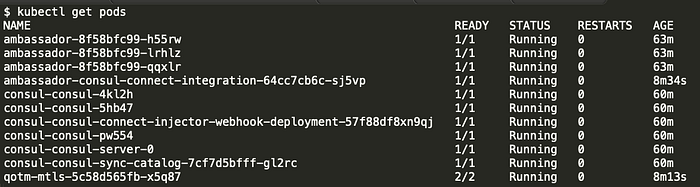
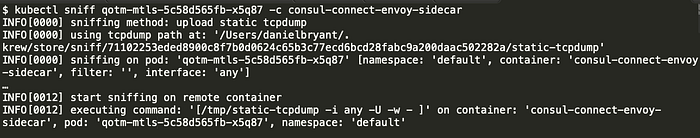
Let’s now attach ksniff to your new QOTM pod. If you examine the Pods, you will notice that this version of QOTM has two containers, one for the QOTM service and one for the Consul-managed Envoy sidecar:
You can describe the pod to get the container names, which will also show a bunch of interesting information about how the Envoy sidecar is bootstrapped using an init-container:

The interesting details in the Envoy sidecar init container are highlighted below, which shows the Envoy configuration that is generated and loaded into the sidecar at startup. You can see details of my QOTM service that is listening on port 5000, and you can also see that the Envoy sidecar will be listening to port 20000 on the Pod’s network interface. Make a note of this, as you’ll use this information later in the blog post.
...
      cat <<EOF >/consul/connect-inject/service.hcl
      services {
        id   = "${POD_NAME}-qotm-sidecar-proxy"
        name = "qotm-sidecar-proxy"
        kind = "connect-proxy"
        address = "${POD_IP}"
        port = 20000

        proxy {
          destination_service_name = "qotm"
          destination_service_id = "qotm"
          local_service_address = "127.0.0.1"
          local_service_port = 5000

        }
...
If you don’t want to use a full describe command at this point, you can also use a bit of kubectl magic to get the container names from the “qotm-mtls” labeled Pod:
$ kubectl get pods -l app=qotm-mtls -o jsonpath={.items[].spec.containers[*].name}qotm consul-connect-envoy-sidecar
Here you can see the Consul injected Envoy sidecar is called “consul-connect-envoy-sidecar”.
When attaching ksniff to a Pod with multiple containers, must specify which container to attach to. As all containers within a Pod share a network namespace, the choice of container usually comes down to which one you can successfully attach to e.g. which one has the correct privileges and is not running a scratch base image etc.
Find out more in the Advanced techniques section below.
I’ll now attach ksniff to my QOTM pod and Envoy sidecar container:
If I add the “http” filter to Wireshark and make a request to my QOTM service, this is what I see:
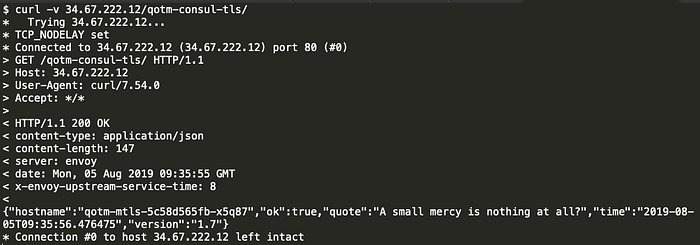
Everything looks quite similar to the previous example, except note the source and destination IP addresses: they are both 127.0.0.1. What you see here is the unencrypted traffic between the Consul Envoy sidecar and the QOTM service, which are communicating over the Pod’s localhost loopback adapter.
This works between containers because all containers within a Pod share a network namespace. As a slight aside, it’s worth noting that in production, the QOTM service should only bind to the Pod’s loopback adapter, as you don’t want any processes outside of the Pod communicating with it over an insecure transport medium (i.e. HTTP). This will, however, mean that HTTP readiness checks (which are made via the Node’s kubelet) won’t work, and so you’ll have to use some other form of readiness check.
Seeing that unencrypted communication to the QOTM service is only occurring over the loopback adapter is only one part of the TLS verification process. You ideally want to see the encrypted traffic flowing around your cluster. You can do this by removing the “http” filter, and instead adding a display filter to only show TCP traffic with a destination IP address of your QOTM Pod and a target port of 20000, which you can see that the Envoy sidecar is listening on via the earlier issued kubectl describe command.
If you’re quick (as there is typically a lot of health check traffic flying around the cluster), you should be able to see something like the following:
Although this isn’t quite as easy to read as the HTTP traffic, you can clearly see the “Client Hello” TLS handshake being initiated by an Ambassador Pod (at 10.60.0.11) to my QOTM application (at 10.60.2.7), and then a series of other packets that use the TLSv1.2 protocol that contain the unreadable encrypted data.
There you have it. Putting the two results together, one of the QOTM responding to a request from the Consul Envoy proxy via the Pod’s loopback adapter, and two, the Ambassador Pod communicating with the QOTM Consul Envoy sidecar via TLS, should prove that you have configured TLS correctly.
Advanced techniques
There are a couple of topics that were out of scope for this blog post, but I can potentially explore them in a future article (let me know if this is of interest!). The first is using Wireshark to conduct additional advanced filtering, which can be useful when you’re trying to debug specific services that are exposed on different IPs and ports. Also interesting is the ability to decrypt TLS traffic flowing around the cluster, for example, by loading the private keys provided by Consul into Wireshark. And finally, ksniff also has the ability to execute in privileged mode in order to sniff traffic in containers that are built from scratch, or do not allow the attaching of a process.
Conclusion
I’ve found ksniff to be an invaluable tool when exploring the Ambassador API integrations with various service meshes, such as Consul, Linkerd, and Istio. Sure, you can use tcpdump, but I’ve found configuring this challenging at times, and I like the powerful GUI that Wireshark offers.
I would also like to say a big thanks to ksniff’s creator, Eldad Rudich, for creating the tool and for his help in answering several questions I had.
If you want to ask any questions you can find me at @danielbryantuk on Twitter or using the same handle on the Ambassador Labs Slack Channel.